Cap and Trade Networking Software,
that makes the EU-ETS cheaper, better and easier.
that makes the EU-ETS cheaper, better and easier.
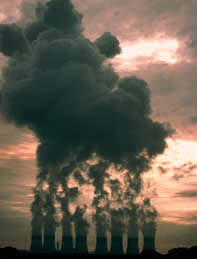
itet monitors emissions from stacks and other emissions outlets in real-time. During sensor installation you choose the source points around the site that you would like to be monitored in real time. Data is then available to local or global arms of your organization via the network in real-time or near real-time.
You can view emissions operations profile from two views:
The Source Point views let you view and manage emissions data from the context of the releasing stacks and other emissions outlets. The Activity views let you view your emissions from the perspective of the activities that generate them.
itet’s user friendly features allow you to use Graphical models to access, view, manipulate and manage data, throughout your itet session.
The software provides statistics and data analysis functions to be applied to your data to enable you to interpret and understand it with greater insight. The functions are designed to help you discover trends, summarise local and overall state of your installation at a specified periods in time. One of the ways of helping you turn your data into information and information into knowledge.
Different data capture packages are available in either measurement or calculation methodologies. You can combine both measurement and calculation data capture packages to produce data certainty at near 100% levels.